

The abandonment metric is well known, but the fundamental questions remain unanswered. Where exactly does the dropout occur? For which specific reasons? And how can this scenario be reversed?
Given this, the difference between reactive and proactive operations lies in the ability to answer these questions with surgical precision.
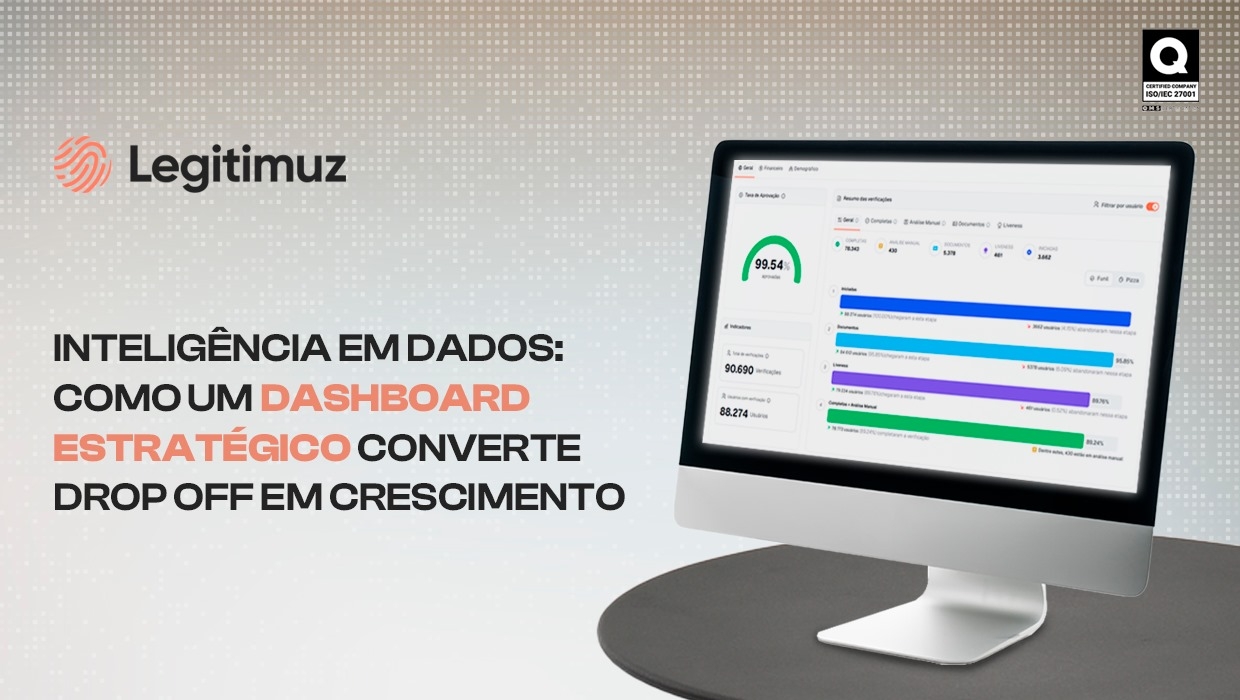
A truly strategic identity verification dashboard goes beyond functioning as a static report and becomes an operational intelligence hub, turning every friction point into a measurable opportunity for optimization and growth.
The gap in conventional dashboards
The traditional operational monitoring model focuses mainly on input and output metrics: the number of users who start the journey and how many are actually approved.
While this view meets basic compliance and regulatory reporting requirements, it provides insufficient visibility for operations seeking continuous optimization and sustainable growth.
The most common limitations that hinder operational intelligence include:
* Lack of granular visibility: it is not possible to view the performance of each stage of the funnel (CPF, Document, Liveness);
* Aggregated metrics: general numbers mask the specific problems causing abandonment;
* No diagnostics: they show that the user dropped off, but not why;
* Static data: no ability to drill down into the analysis to investigate anomalies;
* Outdated information: daily or weekly reports instead of real-time data for agile decision-making.
Operating under these limitations forces teams to make decisions based on assumptions, wasting valuable resources on adjustments that do not address the root of the problem.
The four visibility layers of a strategic dashboard
The difference between an operational dashboard and a strategic one lies in the depth and integration of the information presented.
A truly effective platform structures data into progressive layers of analysis, where each level adds context and diagnostic capability to the previous one.
These layers work in an integrated manner: the first provides the structural mapping of the process, the second identifies critical drop-off points, the third reveals behavioral and technological patterns, and the fourth adds business context through complementary data.
Together, they transform raw numbers into actionable intelligence that guides decisions across product, operations, marketing, and compliance.
Layer 1: complete mapping of the verification funnel
A high-performance dashboard breaks down the KYC process into its fundamental stages, allowing for individual analysis of each phase:
* Initial checks (CPF lookup): the first validation barrier. It is essential to monitor entry volume, processing time, and rejection rates due to data inconsistencies, identifying the first abandonment point.
* Document upload: a critical stage involving image capture. Visibility should include performance by document type (ID, driver’s license, passport, etc.), the status of each upload (approved, invalid, in progress), and the reupload rate due to quality issues.
* Liveness with Face Match: facial recognition with liveness detection and automated validation comparing the document to biometric data.
Layer 2: detailed drop-off diagnostics with root cause analysis
The real game changer lies not in answering “how many abandoned?” but “why did they abandon each stage?”
A dashboard that truly supports operations categorizes abandonment reasons into actionable groups, turning a problem into a plan:
* No capture: the user accesses the stage but doesn’t start the action. This may indicate confusing UX or hesitation.
* Camera blocked: the browser or OS prevents camera access. Diagnostics point to denied permissions or technical incompatibility.
* Invalid or unreadable document: the image is unsuitable for OCR data extraction. The cause may be poor framing, for example.
* Facial recognition error: biometric capture fails, often due to lighting conditions or difficulty following instructions.
Layer 3: performance intelligence and behavioral patterns
An advanced dashboard correlates data to reveal patterns that enable high-impact optimizations, such as:
* Performance by document type: comparing approval rates between IDs, driver’s licenses, and other documents can show that the driver’s license, being more standardized, may convert better.
* Identification of access peaks: visualizing verification volumes by hour and day of the week has dual benefits. For operations, it enables better analyst allocation; for marketing, it optimizes paid media during high-conversion periods.
* Technology distribution: segmenting users by OS (iOS/Android) and browser (Chrome, Safari, Instagram) helps identify platform-specific technical issues and develop targeted solutions.
Layer 4: complementary data for business intelligence
Sophisticated operations extract additional value from dashboards that integrate information beyond basic KYC. This complementary layer transforms verification into a source of strategic intelligence for multiple business areas.
Consolidated demographic profile:
* Distribution by: gender, age group, and geographic concentration
* Technological profile: OS, browsers, traffic source
* Strategic value: marketing segmentation, product development aligned to real users, identification of expansion opportunities
Integrated financial data:
* Estimated income and economic class distribution
* Average credit score and category ranges
* Income source: self-employed, salaried, business owner, social program beneficiary
* Strategic value: data-driven risk management, personalized limits, bonus strategies aligned with purchasing power
Risk pattern detection:
* Ranking of users with multiple verification attempts
* Correlation of IPs, devices, and inconsistent locations
* Discrepancies between declared data and official databases
* Strategic value: fraud prevention, chargeback reduction, priority flags for compliance
The compound impact on business indicators
The intelligence extracted from a strategic dashboard extends beyond isolated operational improvements. Each optimization based on precise diagnostics generates a cascading effect across multiple performance indicators.
The result is a virtuous cycle where improved user experience directly translates into financial efficiency and sustainable competitive advantage.
Three main dimensions concentrate the measurable impact:
* Conversion and revenue: every percentage point gained in conversion means more approved customers with the same acquisition investment. In mid-size operations, this may represent tens of thousands of reais in additional monthly revenue.
* CAC efficiency: reducing drop-off boosts the return on marketing spend. Improving market-standard conversion from 65% to 85% meaningfully reduces the effective cost per approved user—savings that scale significantly.
* Competitive advantage: a frictionless onboarding experience, achieving 85% conversion in under 30 seconds, is a powerful differentiator. In today’s market, lower friction determines who wins the customer.
Is your operation already using the dashboard as a strategic asset?
The market has evolved. Dashboards that merely meet minimum regulatory requirements are no longer enough for operations seeking sustainable growth and competitive efficiency.
Modern platforms function as operational intelligence centers, where each data point becomes an informed decision and every optimization delivers direct impact on conversion, cost reduction, and user experience.
For this reason, implementing a truly strategic dashboard requires integration between robust technical capabilities and a multi-layer analytical structure.
The result is the transformation of the identity verification process—from a regulatory obligation into a measurable growth engine.
Operations that adopt this data-driven approach build sustainable competitive advantages, optimize existing resources, and create onboarding experiences that differentiate their brand from the very first user interaction.
Caio Brisola
Head of Product at Legitimuz
Legitimuz is an integrated identity verification and compliance platform for digital operations in regulated sectors. The solution achieves conversion rates above 85% with processes completed in under 30 seconds. Its key differentiator lies in the integration of advanced verification technology with dashboards that deliver full funnel transparency, real-time dropout diagnostics, and integrated complementary data—turning identity verification into an operational intelligence hub.